This week, I decided to focus on a few dApps that have shown great numbers in the areas I value. I used the performance tags below to find the top candidates by hard metrics, and from there, I picked the ones I value on the softer metrics (community involvement, updates, roadmap, etc.).
The candidates were selected with this weight:
- Ecosystem Growth (New Users) (Weight: 10%)
- Account Retention (Stickiness) (Weight: 15%)
- Reward Utilization (Distribution) (Weight: 20%)
- Signaling (Weight: 30%)
- Ecosystem Synergy (Cross-Pollination) (Weight: 25%)
Signaling and ecosystem synergy were weighted the highest because they are the two metrics I believe show dApp engagement to protect the app and DAO from bad actors.
While ecosystem growth is important, it is harder to measure. One dApp that is exploited will have a large amount of new “users,” but unless those users are also using other dApps (especially in the days of B3MO Quests highly incentivizing trying new dApps), it is more likely that the users are just fake accounts.
If a dApp has both new accounts as well as a high synergy percentage, it indicates a higher amount of legitimate users.
After my motivations for the round, I’ve gathered some stats on the voter rewards from early rounds of freshness.
Let’s jump in!
To ensure a fair and stable analysis, all growth and security metrics are calculated as a 4-round rolling total (approx. 8 weeks). Growth indicators (▲/▼) represent the change between the current window and the previous overlapping window (a 1-round shift, e.g., Rounds 94-97 vs. 93-96). This methodology filters out biweekly volatility to highlight sustained ecosystem trends.
 Reheat’s Allocation & Notes
ST3PR

They’ve also been quick to implement the new function to distribute rewards based on the actual round it was performed in, making ‘pre-loading’ of actions for B3MO Quests impossible. Great stuff."
| Ecosystem Growth | 201▲4 | |
| App Discovery | 358▼3 | |
| Account Retention | 85%▲1% | |
| Ecosystem Synergy | 45%▼12% | |
| Reward Utilization | 51%▼2% | |
| Bot Signaling | 60(--) |
Cleanify
The app is simple to use and with the addition of refillable bottles and reusable bags added as an option recently, Cleanify is quickly becoming the ‘everything’ dApp.
Just like ST3PR, Cleanify was also quick to add the new distribute function for quests."
In addition, with so many available actions now (that all share one cooldown), users could just do the easiest one every time, with no reason to do any of the other actions. It would be good to see reasons to try other modes (which they’ve teased a solution on with a wheel spin feature)"
| Ecosystem Growth | 46▲13 | |
| App Discovery | 134▲16 | |
| Account Retention | 82%(--) | |
| Ecosystem Synergy | 23%▼13% | |
| Reward Utilization | 48%▼3% | |
| Bot Signaling | 550(--) |
Cleanmate

Finally, they're not relying on user-signed transactions for their rewards and have a pretty short cooldown on submission, making it easy to come back often. "
| Ecosystem Growth | 314▼64 | |
| App Discovery | 664▼183 | |
| Account Retention | 62%▲3% | |
| Ecosystem Synergy | 28%▲5% | |
| Reward Utilization | 83%▼128% | |
| Bot Signaling | 29(--) |
ScoopUp

The V2 of the app is looking great, now we just need the momentum to continue, so I want to support their efforts."
| Ecosystem Growth | 5▲1 | |
| App Discovery | 77▲33 | |
| Account Retention | 76%▼4% | |
| Ecosystem Synergy | 13%(--) | |
| Reward Utilization | 41%▲1% | |
| Bot Signaling | 6(--) |
Avoco

| Ecosystem Growth | 9▲2 | |
| App Discovery | 199▼6 | |
| Account Retention | 89%▼1% | |
| Ecosystem Synergy | 42%▲25% | |
| Reward Utilization | 59%▼18% | |
| Bot Signaling | 35(--) |
Green Ambassador Challenge

In addition, their reward utilization is very strong, despite the low B3TR value currently. This means they’re self-funding operations instead of withdrawing more to sustain themselves which is great to see."
| Ecosystem Growth | 457▼65 | |
| App Discovery | 470▼76 | |
| Account Retention | 62%▲1% | |
| Ecosystem Synergy | 0%(--) | |
| Reward Utilization | 87%▼20% | |
| Bot Signaling | 196(--) |
Closing thoughts
Last rounds we’ve looked at freshness data. Now we’ve started to see some data on the actual impact on voter rewards as well, so this week we are analysing that.
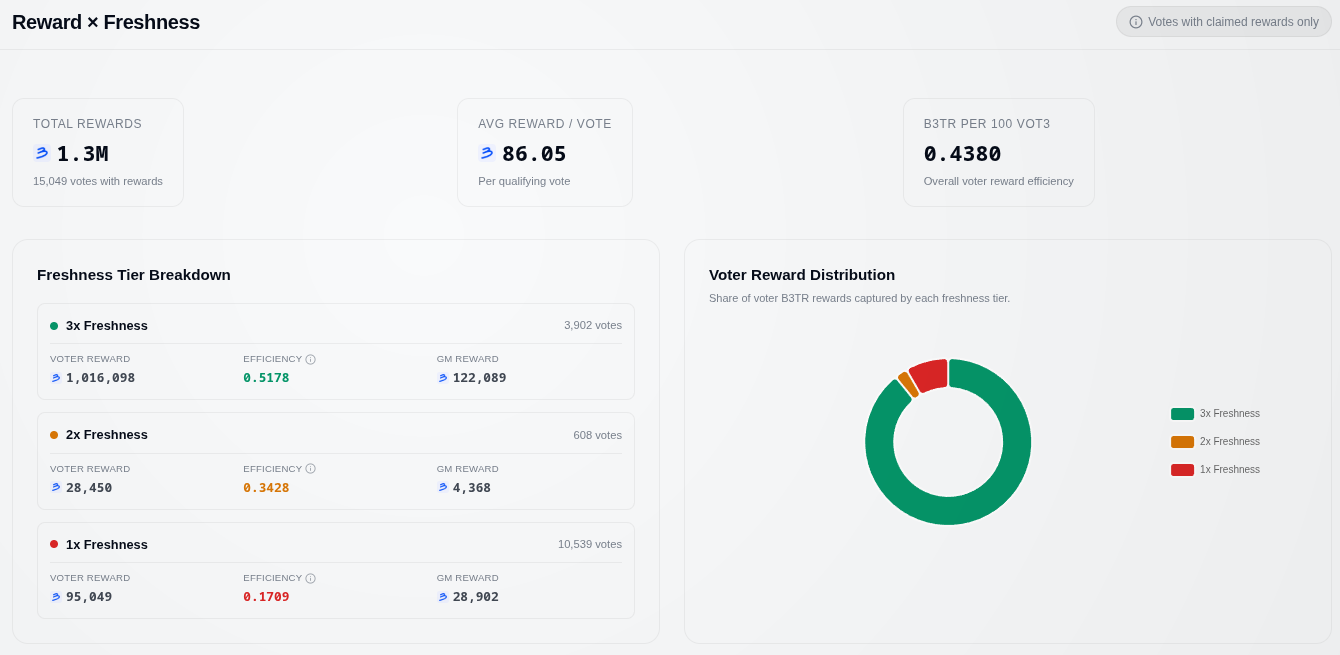
This sample is taken from round 100 votes (rewards claimed in round 101). As round 102 is not yet complete we do not yet have complete numbers from there.
‘Efficiency’ is the most interesting number here. It shows the B3TR Earnt per 100 VOT3 across the different freshness multipliers.
Takeaways
-
Active voters take almost everything: The donut chart shows that the 3x Freshness group captured 89.1% of all voter rewards, even though they only made up about a quarter of the total voters (but the .
-
The multiplier works exactly as designed: Voters who updated their apps this round earned rewards at a rate 3x higher () than those who haven’t updated in 3+ rounds ().
-
Most wallets are still unaware of freshness: Roughly 70% of all voters (over 10,500 votes) sat in the lowest 1x tier, meaning the vast majority of wallets are voting with stale preferences and missing out on big rewards.
 Reheat’s Ecosystem Analysis
A data-driven deep dive into the entire VeBetterDAO ecosystem. All growth and security metrics are calculated as a 4-round rolling total to identify long-term trends and sustainable participation.
 Ecosystem Funding Dominance
This leaderboard shows the total B3TR funding captured by applications in the ecosystem (Voting Allocations + Dynamic Base Allocation), and where my votes landed on this leaderboard.
| # | Application | Total Funding (Inc. DBA %) | Voted |
|---|---|---|---|
| 1 | 261 837 (2 137 • 1%) | ||
| 2 | 261 837 (2 137 • 1%) | ||
| 3 | 196 479 (2 137 • 1%) | ✓ | |
| 4 | 170 798 (2 137 • 1%) | ||
| 5 | 93 032 (2 137 • 2%) | ||
| 6 | 83 798 (2 137 • 3%) | ✓ | |
| 7 | 44 987 (2 137 • 5%) | ||
| 8 | 33 589 (2 137 • 6%) | ||
| 9 | 30 559 (2 137 • 7%) | ✓ | |
| 10 | 26 664 (2 137 • 8%) | ||
| 11 | 25 077 (2 137 • 9%) | ||
| 12 | 15 555 (2 137 • 14%) | ✓ | |
| 13 | 14 545 (2 137 • 15%) | ||
| 14 | 14 112 (2 137 • 15%) | ||
| 15 | 12 669 (2 137 • 17%) | ||
| 16 | 10 938 (2 137 • 20%) | ✓ | |
| 17 | 10 505 (2 137 • 20%) | ||
| 18 | 10 361 (2 137 • 21%) | ||
| 19 | 10 216 (2 137 • 21%) | ||
| 20 | 9 783 (2 137 • 22%) | ||
| 21 | 9 062 (2 137 • 24%) | ||
| 22 | 8 196 (2 137 • 26%) | ||
| 23 | 7 042 (2 137 • 30%) | ||
| 24 | 6 609 (2 137 • 32%) | ✓ | |
| 25 | 6 032 (2 137 • 35%) | ||
| 26 | 5 311 (2 137 • 40%) | ||
| 27 | 5 167 (2 137 • 41%) | ||
| 28 | 4 445 (2 137 • 48%) | ||
| 29 | 3 868 (2 137 • 55%) | ||
| 30 | 3 579 (2 137 • 60%) | ||
| 31 | 2 597 (1 731 • 67%) | ||
| 32 | 2 597 (1 731 • 67%) | ||
| 33 | 2 597 (1 731 • 67%) | ||
| 34 | 2 164 (1 443 • 67%) | ||
| 35 | 2 164 (1 443 • 67%) | ||
| 36 | 2 164 (1 443 • 67%) | ||
| 37 | 1 731 (1 154 • 67%) | ||
| 38 | 1 299 (866 • 67%) | ||
| 39 | 1 299 (866 • 67%) | ||
| 40 | 1 299 (866 • 67%) | ||
| 41 | 433 (289 • 67%) | ||
| 42 | 433 (289 • 67%) |
 Network Expansion (Last 4 Rounds)
Measures apps bringing new accounts into VeBetterDAO. Counts accounts whose first-ever action was on this app. Higher averages indicate sustainable ecosystem expansion.
Note: BigBottle was heavily farmed with an automated exploit, but the issue has since been resolved.
 View Full Leaderboard
Full Ecosystem Leaderboard
| # | Application | New Accounts |
|---|---|---|
| 1 | 35010 | |
| 2 | 550 | |
| 3 | 457 | |
| 4 | 414 | |
| 5 | 314 | |
| 6 | 272 | |
| 7 | 207 | |
| 8 | 201 | |
| 9 | 119 | |
| 10 | 77 | |
| 11 | 68 | |
| 12 | 66 | |
| 13 | 46 | |
| 14 | 42 | |
| 15 | 24 | |
| 16 | 20 | |
| 17 | 18 | |
| 18 | 12 | |
| 19 | 11 | |
| 20 | 9 | |
| 21 | 9 | |
| 22 | 7 | |
| 23 | 6 | |
| 24 | 5 | |
| 25 | 4 | |
| 26 | 3 | |
| 27 | 2 | |
| 28 | 2 | |
| 29 | 2 | |
| 30 | 1 | |
| 31 | 1 | |
| 32 | 1 | |
| 33 | 1 | |
| 34 | 1 | |
| 35 | 1 | |
| 36 | 1 |
 Ecosystem Synergy (Last 4 Rounds)
Measures ecosystem value. Percentage of new accounts an app onboarded who went on to use other apps. High scores indicate apps that foster exploration rather than isolated farming.
View Full Leaderboard
Full Ecosystem Leaderboard
| # | Application | Score |
|---|---|---|
| 1 | 76% | |
| 2 | 72% | |
| 3 | 63% | |
| 4 | 50% | |
| 5 | 45% | |
| 6 | 42% | |
| 7 | 36% | |
| 8 | 34% | |
| 9 | 28% | |
| 10 | 25% | |
| 11 | 25% | |
| 12 | 23% | |
| 13 | 21% | |
| 14 | 15% | |
| 15 | 13% | |
| 16 | 13% | |
| 17 | 13% | |
| 18 | 6% | |
| 19 | 4% | |
| 20 | 2% | |
| 21 | 0% | |
| 22 | 0% | |
| 23 | 0% | |
| 24 | 0% | |
| 25 | 0% | |
| 26 | 0% | |
| 27 | 0% | |
| 28 | 0% | |
| 29 | 0% | |
| 30 | 0% | |
| 31 | 0% | |
| 32 | 0% | |
| 33 | 0% | |
| 34 | 0% | |
| 35 | 0% | |
| 36 | 0% | |
| 37 | 0% | |
| 38 | 0% | |
| 39 | 0% | |
| 40 | 0% | |
| 41 | 0% | |
| 42 | 0% |
 Account Retention (Last 4 Rounds)
Measures sticky engagement. Percentage of accounts from the previous round who returned to use the app again. Consistent high retention is a key indicator of product-market fit.
View Full Leaderboard
Full Ecosystem Leaderboard
| # | Application | Retention |
|---|---|---|
| 1 | 98% | |
| 2 | 97% | |
| 3 | 96% | |
| 4 | 96% | |
| 5 | 95% | |
| 6 | 95% | |
| 7 | 94% | |
| 8 | 93% | |
| 9 | 93% | |
| 10 | 90% | |
| 11 | 90% | |
| 12 | 89% | |
| 13 | 89% | |
| 14 | 88% | |
| 15 | 88% | |
| 16 | 88% | |
| 17 | 88% | |
| 18 | 86% | |
| 19 | 85% | |
| 20 | 85% | |
| 21 | 82% | |
| 22 | 80% | |
| 23 | 80% | |
| 24 | 79% | |
| 25 | 76% | |
| 26 | 75% | |
| 27 | 74% | |
| 28 | 74% | |
| 29 | 71% | |
| 30 | 68% | |
| 31 | 65% | |
| 32 | 65% | |
| 33 | 62% | |
| 34 | 62% | |
| 35 | 49% | |
| 36 | 38% | |
| 37 | 32% | |
| 38 | 27% | |
| 39 | 18% | |
| 40 | 11% | |
| 41 | 9% | |
| 42 | 0% |
 Defensive Gap Analysis (Last 4 Rounds)
Measures dApp protections. Rewards distributed to accounts AFTER they were officially flagged as bots. This highlights where an app ignores ecosystem signals, continuing to reward bad actors already identified by others.
Methodology Note: To ensure fairness, we only count rewards distributed AFTER the account was officially signaled. If an app rewards a flagged account, it is considered a leak. Learn more about Bot Signaling
Full Leaderboard: By Total Amount
Ranked by absolute B3TR amount leaked
| # | Application | B3TR Leaked |
|---|---|---|
| 1 | 17 590 B3TR | |
| 2 | 8 746 B3TR | |
| 3 | 1 609 B3TR | |
| 4 | 1 561 B3TR | |
| 5 | 1 272 B3TR | |
| 6 | 1 109 B3TR | |
| 7 | 570 B3TR | |
| 8 | 552 B3TR | |
| 9 | 533 B3TR | |
| 10 | 516 B3TR | |
| 11 | 467 B3TR | |
| 12 | 427 B3TR | |
| 13 | 362 B3TR | |
| 14 | 194 B3TR | |
| 15 | 173 B3TR | |
| 16 | 161 B3TR | |
| 17 | 105 B3TR | |
| 18 | 90 B3TR | |
| 19 | 73 B3TR | |
| 20 | 64 B3TR | |
| 21 | 57 B3TR | |
| 22 | 53 B3TR | |
| 23 | 36 B3TR | |
| 24 | 34 B3TR | |
| 25 | 32 B3TR | |
| 26 | 30 B3TR | |
| 27 | 24 B3TR | |
| 28 | 22 B3TR | |
| 29 | 11 B3TR | |
| 30 | 5 B3TR | |
| 31 | 5 B3TR | |
| 32 | 3 B3TR | |
| 33 | 2 B3TR | |
| 34 | 1 B3TR | |
| 35 | 0 B3TR | |
| 36 | 0 B3TR |
Full Leaderboard: By % of Allocation
Ranked by percentage of total allocation leaked
| # | Application | Leak % |
|---|---|---|
| 1 | 3.1% | |
| 2 | 1.9% | |
| 3 | 1.7% | |
| 4 | 1.6% | |
| 5 | 1.5% | |
| 6 | 1.5% | |
| 7 | 1.0% | |
| 8 | 0.8% | |
| 9 | 0.7% | |
| 10 | 0.6% | |
| 11 | 0.6% | |
| 12 | 0.5% | |
| 13 | 0.5% | |
| 14 | 0.5% | |
| 15 | 0.5% | |
| 16 | 0.4% | |
| 17 | 0.4% | |
| 18 | 0.3% | |
| 19 | 0.3% | |
| 20 | 0.3% | |
| 21 | 0.2% | |
| 22 | 0.2% | |
| 23 | 0.2% | |
| 24 | 0.2% | |
| 25 | 0.2% | |
| 26 | 0.2% | |
| 27 | 0.1% | |
| 28 | 0.1% | |
| 29 | 0.1% | |
| 30 | 0.1% | |
| 31 | 0.0% | |
| 32 | 0.0% | |
| 33 | 0.0% | |
| 34 | 0.0% | |
| 35 | 0.0% | |
| 36 | 0.0% |
 Bot Signaling & Fraud Prevention (28-Day Activity)
Measures active defense. Apps using their SIGNALER_ROLE to flag suspicious addresses (bots/scammers) to the VeBetter ecosystem. These are the apps doing the “hard work” to protect the ecosystem for everyone else. “Writes” are new signals created, while “Resets” are removals of prior signals (often used to revert accidental/collateral signals).
For more information on how to integrate these checks, see the VeBetterDAO Bot Signaling Docs.
Note: Mugshot has signaled a vast amount of farmer wallets that were ‘kept alive’ with their monthly leaderboard rewards counting as valid proofs. This was a one-off signal on June 7th and not a continued signaling pattern since. Kudos to Morb for pushing them to signal these wallets. Thanks Mugshot for signaling.
View Full Leaderboard
Full Ecosystem Leaderboard
| # | Application | Writes | Resets | Total |
|---|---|---|---|---|
| 1 | 2667 | 0 | 2667 | |
| 2 | 549 | 1 | 550 | |
| 3 | 179 | 17 | 196 | |
| 4 | 56 | 4 | 60 | |
| 5 | 44 | 3 | 47 | |
| 6 | 35 | 0 | 35 | |
| 7 | 28 | 1 | 29 | |
| 8 | 15 | 0 | 15 | |
| 9 | 6 | 0 | 6 | |
| 10 | 6 | 0 | 6 |
 Data Dump
The raw (non-aggregated) data for this report, including transaction IDs, can be found in the link below.
