This week, I decided to highlight two dApps that have shown great progress in recent weeks.
To ensure a fair and stable analysis, all growth and security metrics are calculated as a 4-round rolling total (approx. 8 weeks). Growth indicators (▲/▼) represent the change between the current window and the previous overlapping window (a 1-round shift, e.g., Rounds 94-97 vs. 93-96). This methodology filters out biweekly volatility to highlight sustained ecosystem trends.
 Reheat’s Allocation & Notes
Avoco

In addition, they have added recipe tracking for your meals. After scanning, you can save a meal as a recipe, and whatever ingredients their AI picks up on in your meal are automatically filled in."
| Ecosystem Growth | 7▼2 | |
| App Discovery | 148▼14 | |
| Account Retention | 89%(--) | |
| Ecosystem Synergy | 33%▼9% | |
| Reward Utilization | 65%▼10% | |
| Bot Signaling | 29(--) |
Cleanmate
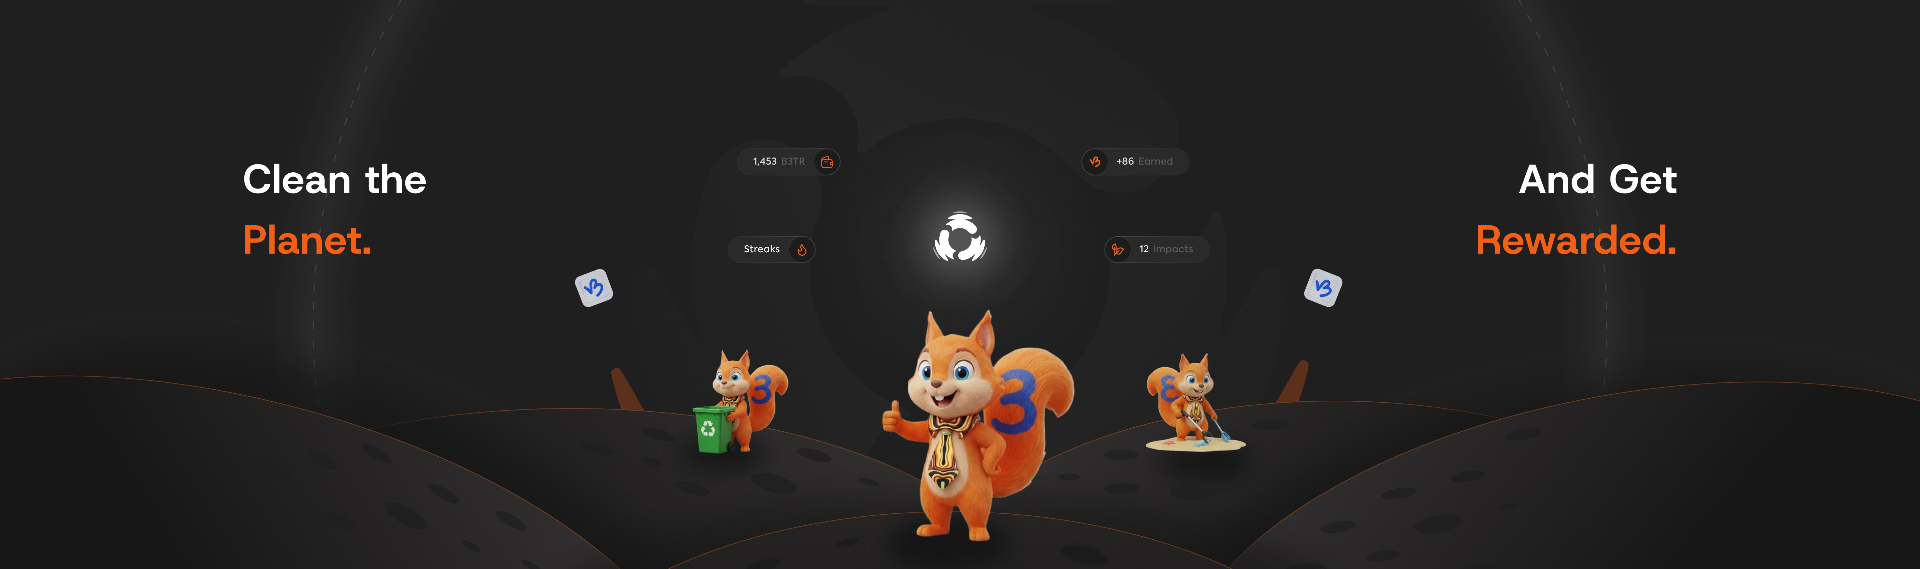
It seems to function well so far; I am not seeing too many complaints on their Telegram.
Ibrahim continues to have outstanding support with near-instant response times, and their new World Cup betting system is interesting, letting users bet their streaks (actions in Cleanmate) on the results of the games. It is a great community builder.
Impressive work!"
| Ecosystem Growth | 22▼254 | |
| App Discovery | 218▼317 | |
| Account Retention | 75%▲8% | |
| Ecosystem Synergy | 58%▲24% | |
| Reward Utilization | 122%▲50% | |
| Bot Signaling | 0(--) |
Closing thoughts
I have been abroad for the past two weeks, so I apologise for this report being slightly shorter than usual.
See you next report!
 Reheat’s Ecosystem Analysis
A data-driven deep dive into the entire VeBetterDAO ecosystem. All growth and security metrics are calculated as a 4-round rolling total to identify long-term trends and sustainable participation.
 Ecosystem Funding Dominance
This leaderboard shows the total B3TR funding captured by applications in the ecosystem (Voting Allocations + Dynamic Base Allocation), and where my votes landed on this leaderboard.
| # | Application | Total Funding (Inc. DBA %) | Voted |
|---|---|---|---|
| 1 | 260 713 (1 013 • 0%) | ||
| 2 | 260 713 (1 013 • 0%) | ||
| 3 | 189 007 (1 013 • 1%) | ||
| 4 | 178 475 (1 013 • 1%) | ||
| 5 | 109 222 (1 013 • 1%) | ||
| 6 | 102 873 (1 013 • 1%) | ||
| 7 | 46 316 (1 013 • 2%) | ✓ | |
| 8 | 43 287 (1 013 • 2%) | ||
| 9 | 27 705 (1 013 • 4%) | ||
| 10 | 26 550 (1 013 • 4%) | ||
| 11 | 23 232 (1 013 • 4%) | ||
| 12 | 13 998 (1 013 • 7%) | ||
| 13 | 13 854 (1 013 • 7%) | ||
| 14 | 12 988 (1 013 • 8%) | ||
| 15 | 11 978 (1 013 • 8%) | ||
| 16 | 9 381 (1 013 • 11%) | ||
| 17 | 9 093 (1 013 • 11%) | ||
| 18 | 8 227 (1 013 • 12%) | ||
| 19 | 8 083 (1 013 • 13%) | ||
| 20 | 7 073 (1 013 • 14%) | ||
| 21 | 6 929 (1 013 • 15%) | ||
| 22 | 6 063 (1 013 • 17%) | ||
| 23 | 4 909 (1 013 • 21%) | ✓ | |
| 24 | 4 476 (1 013 • 23%) | ||
| 25 | 4 332 (1 013 • 23%) | ||
| 26 | 4 187 (1 013 • 24%) | ||
| 27 | 3 755 (1 013 • 27%) | ||
| 28 | 3 322 (1 013 • 31%) | ||
| 29 | 2 600 (1 013 • 39%) | ||
| 30 | 2 456 (1 013 • 41%) | ||
| 31 | 2 023 (1 013 • 50%) | ||
| 32 | 2 023 (1 013 • 50%) | ||
| 33 | 1 879 (1 013 • 54%) | ||
| 34 | 1 735 (1 013 • 58%) | ||
| 35 | 1 735 (1 013 • 58%) | ||
| 36 | 1 735 (1 013 • 58%) | ||
| 37 | 1 590 (1 013 • 64%) | ||
| 38 | 1 590 (1 013 • 64%) | ||
| 39 | 1 299 (866 • 67%) | ||
| 40 | 1 299 (866 • 67%) | ||
| 41 | 1 299 (866 • 67%) | ||
| 42 | 1 299 (866 • 67%) | ||
| 43 | 433 (289 • 67%) | ||
| 44 | 433 (289 • 67%) |
 Network Expansion (Last 4 Rounds)
Measures apps bringing new accounts into VeBetterDAO. Counts accounts whose first-ever action was on this app. Higher averages indicate sustainable ecosystem expansion.
Note: BigBottle was heavily farmed with an automated exploit, but the issue has since been resolved.
 View Full Leaderboard
Full Ecosystem Leaderboard
| # | Application | New Accounts |
|---|---|---|
| 1 | 28817 | |
| 2 | 403 | |
| 3 | 315 | |
| 4 | 281 | |
| 5 | 233 | |
| 6 | 225 | |
| 7 | 117 | |
| 8 | 105 | |
| 9 | 84 | |
| 10 | 65 | |
| 11 | 64 | |
| 12 | 57 | |
| 13 | 39 | |
| 14 | 36 | |
| 15 | 22 | |
| 16 | 19 | |
| 17 | 13 | |
| 18 | 12 | |
| 19 | 9 | |
| 20 | 7 | |
| 21 | 7 | |
| 22 | 7 | |
| 23 | 5 | |
| 24 | 5 | |
| 25 | 5 | |
| 26 | 4 | |
| 27 | 3 | |
| 28 | 3 | |
| 29 | 2 | |
| 30 | 2 | |
| 31 | 2 | |
| 32 | 1 | |
| 33 | 1 | |
| 34 | 1 | |
| 35 | 1 |
 Ecosystem Synergy (Last 4 Rounds)
Measures ecosystem value. Percentage of new accounts an app onboarded who went on to use other apps. High scores indicate apps that foster exploration rather than isolated farming.
View Full Leaderboard
Full Ecosystem Leaderboard
| # | Application | Score |
|---|---|---|
| 1 | 83% | |
| 2 | 63% | |
| 3 | 58% | |
| 4 | 50% | |
| 5 | 38% | |
| 6 | 33% | |
| 7 | 33% | |
| 8 | 32% | |
| 9 | 25% | |
| 10 | 22% | |
| 11 | 20% | |
| 12 | 17% | |
| 13 | 13% | |
| 14 | 13% | |
| 15 | 8% | |
| 16 | 4% | |
| 17 | 4% | |
| 18 | 3% | |
| 19 | 1% | |
| 20 | 0% | |
| 21 | 0% | |
| 22 | 0% | |
| 23 | 0% | |
| 24 | 0% | |
| 25 | 0% | |
| 26 | 0% | |
| 27 | 0% | |
| 28 | 0% | |
| 29 | 0% | |
| 30 | 0% | |
| 31 | 0% | |
| 32 | 0% | |
| 33 | 0% | |
| 34 | 0% | |
| 35 | 0% | |
| 36 | 0% | |
| 37 | 0% | |
| 38 | 0% | |
| 39 | 0% | |
| 40 | 0% | |
| 41 | 0% | |
| 42 | 0% | |
| 43 | 0% | |
| 44 | 0% |
 Account Retention (Last 4 Rounds)
Measures sticky engagement. Percentage of accounts from the previous round who returned to use the app again. Consistent high retention is a key indicator of product-market fit.
View Full Leaderboard
Full Ecosystem Leaderboard
| # | Application | Retention |
|---|---|---|
| 1 | 98% | |
| 2 | 96% | |
| 3 | 96% | |
| 4 | 96% | |
| 5 | 95% | |
| 6 | 95% | |
| 7 | 94% | |
| 8 | 93% | |
| 9 | 90% | |
| 10 | 89% | |
| 11 | 89% | |
| 12 | 89% | |
| 13 | 89% | |
| 14 | 88% | |
| 15 | 88% | |
| 16 | 85% | |
| 17 | 85% | |
| 18 | 84% | |
| 19 | 83% | |
| 20 | 83% | |
| 21 | 82% | |
| 22 | 82% | |
| 23 | 81% | |
| 24 | 80% | |
| 25 | 80% | |
| 26 | 78% | |
| 27 | 77% | |
| 28 | 75% | |
| 29 | 75% | |
| 30 | 74% | |
| 31 | 74% | |
| 32 | 68% | |
| 33 | 66% | |
| 34 | 66% | |
| 35 | 65% | |
| 36 | 49% | |
| 37 | 47% | |
| 38 | 40% | |
| 39 | 25% | |
| 40 | 25% | |
| 41 | 22% | |
| 42 | 17% | |
| 43 | 15% | |
| 44 | 0% |
 Defensive Gap Analysis (Last 4 Rounds)
Measures dApp protections. Rewards distributed to accounts AFTER they were officially flagged as bots. This highlights where an app ignores ecosystem signals, continuing to reward bad actors already identified by others.
Methodology Note: To ensure fairness, we only count rewards distributed AFTER the account was officially signaled. If an app rewards a flagged account, it is considered a leak. Learn more about Bot Signaling
Full Leaderboard: By Total Amount
Ranked by absolute B3TR amount leaked
| # | Application | B3TR Leaked |
|---|---|---|
| 1 | 15 254 B3TR | |
| 2 | 7 705 B3TR | |
| 3 | 3 959 B3TR | |
| 4 | 1 249 B3TR | |
| 5 | 1 212 B3TR | |
| 6 | 1 025 B3TR | |
| 7 | 637 B3TR | |
| 8 | 635 B3TR | |
| 9 | 592 B3TR | |
| 10 | 462 B3TR | |
| 11 | 454 B3TR | |
| 12 | 326 B3TR | |
| 13 | 317 B3TR | |
| 14 | 272 B3TR | |
| 15 | 204 B3TR | |
| 16 | 161 B3TR | |
| 17 | 119 B3TR | |
| 18 | 114 B3TR | |
| 19 | 95 B3TR | |
| 20 | 72 B3TR | |
| 21 | 64 B3TR | |
| 22 | 54 B3TR | |
| 23 | 52 B3TR | |
| 24 | 33 B3TR | |
| 25 | 32 B3TR | |
| 26 | 23 B3TR | |
| 27 | 10 B3TR | |
| 28 | 8 B3TR | |
| 29 | 8 B3TR | |
| 30 | 2 B3TR | |
| 31 | 1 B3TR | |
| 32 | 1 B3TR | |
| 33 | 0 B3TR | |
| 34 | 0 B3TR |
Full Leaderboard: By % of Allocation
Ranked by percentage of total allocation leaked
| # | Application | Leak % |
|---|---|---|
| 1 | 7.2% | |
| 2 | 4.1% | |
| 3 | 2.5% | |
| 4 | 2.3% | |
| 5 | 2.1% | |
| 6 | 1.5% | |
| 7 | 1.2% | |
| 8 | 1.0% | |
| 9 | 0.9% | |
| 10 | 0.8% | |
| 11 | 0.7% | |
| 12 | 0.7% | |
| 13 | 0.7% | |
| 14 | 0.5% | |
| 15 | 0.5% | |
| 16 | 0.5% | |
| 17 | 0.5% | |
| 18 | 0.4% | |
| 19 | 0.4% | |
| 20 | 0.4% | |
| 21 | 0.3% | |
| 22 | 0.3% | |
| 23 | 0.2% | |
| 24 | 0.2% | |
| 25 | 0.2% | |
| 26 | 0.1% | |
| 27 | 0.1% | |
| 28 | 0.1% | |
| 29 | 0.1% | |
| 30 | 0.0% | |
| 31 | 0.0% | |
| 32 | 0.0% | |
| 33 | 0.0% | |
| 34 | 0.0% |
 Bot Signaling & Fraud Prevention (28-Day Activity)
Measures active defense. Apps using their SIGNALER_ROLE to flag suspicious addresses (bots/scammers) to the VeBetter ecosystem. These are the apps doing the “hard work” to protect the ecosystem for everyone else. “Writes” are new signals created, while “Resets” are removals of prior signals (often used to revert accidental/collateral signals).
For more information on how to integrate these checks, see the VeBetterDAO Bot Signaling Docs.
Note: Mugshot has signaled a vast amount of farmer wallets that were ‘kept alive’ with their monthly leaderboard rewards counting as valid proofs. This was a one-off signal on June 7th and not a continued signaling pattern since. Kudos to Morb for pushing them to signal these wallets. Thanks Mugshot for signaling.
View Full Leaderboard
Full Ecosystem Leaderboard
| # | Application | Writes | Resets | Total |
|---|---|---|---|---|
| 1 | 2667 | 0 | 2667 | |
| 2 | 29 | 0 | 29 | |
| 3 | 16 | 1 | 17 | |
| 4 | 15 | 1 | 16 | |
| 5 | 11 | 2 | 13 | |
| 6 | 0 | 1 | 1 | |
| 7 | 0 | 1 | 1 |
 Data Dump
The raw (non-aggregated) data for this report, including transaction IDs, can be found in the link below.
https://docs.google.com/spreadsheets/d/1sqLWQgo0GaJN8viSWB1fQLUFQuom4STEpdPb7dx7NxY/edit?usp=sharing
